Investing in Stocks - 6: Buying Stocks
Investing in Stocks - 6: Buying Stocks

In previous articles (see sidebar), we learnt how to analyze stocks and to simulate trading, to help narrow down the stocks that we want to invest in. We also learnt to wait until the stock price is on the rise. Now it is time to go to the next step — the actual buying. In this article, we'll learn to decide how many shares to buy.
How Much to Buy?
Even though it is possible (and tempting) to buy as many shares of the stock as we can afford, a more prudent technique called position sizing allows us to buy incrementally, minimizing exposure to potential loss: we buy a little, wait for the stock price to rise until our investment is safe from a potential price drop, then buy some more, and so on. Position sizing was first described by Van Tharp here. This technique serves as an additional layer of safety on top of picking healthy, non-volatile stocks and waiting for their price up-trend.
Investment Profile Parameters for Position Sizing
To help compute the number of shares using the position sizing technique, we'll add a new parameter per-trade loss threshold amount to our investment profile. This parameter defines how much we are willing to risk losing in a single trade, as in "if the stock price drops soon after we buy the stock." (A typical value for this could be 0.5% to 1% of our total principal available for investing.) Position sizing will use this and the already defined 'peak drop threshold' values.
Position sizing essentially answers the question "what is the maximum number of shares we can buy in a single trade such that even if the stock price subsequently drops by the 'peak drop threshold' percent, the loss will not exceed our 'per-trade loss threshold' amount?"
Updated Sample Investment Profile
This is what our profile looks like now:
| General Parameters | ||
| Parameter | Value | Notes |
|---|---|---|
| Principal | $100,000.00 | Total money available to invest, across all stocks. |
| #Stocks | 10 | Maximum number of shares we'll invest in. |
| Short term tax rate | 33% | Our short term income tax rate. |
| Long term tax rate | 20% | Our long term income tax rate. |
| Analysis Parameters | ||
| Parameter | Value | Notes |
| Health score threshold - performance | 6 | The stock should score at least 6 on the performance scale of 0 to 10. |
| Health score threshold - stability | 6 | The stock should score at least 6 on the stability scale of 0 to 10. |
| Health score threshold - fair price | 4 | The stock should score at least 4 on the fair price scale of 0 to 10. |
| Health score threshold - overall | 5.5 | The overall stock health score (average of the above three scores) should be at least 5.5. |
| Thresholds | ||
| Parameter | Value | Notes |
| Expected gain | 30% | The gain that we're expecting from our stock investment. This could be a conservative value (<10%) or an ambitious value (>25%). |
| Buy threshold | 4% | Percentage points by which a stock's price needs to rise (from its latest lowest value) for us to invest in it. |
| Peak drop threshold | 8% | Percentage points by which a stock's price needs to drop (from its latest highest value) for us to sell it. |
| Per-trade loss threshold amount | $500 | Maximum amount we're willing to risk losing in a single trade. |
Computing Number of Shares to Buy
Now that we've defined the relevant investment profile parameters, we can use our position sizing calculator to compute the number of shares. The calculator takes the following parameters and computes the maximum number of shares that we can safely buy:
- Price of one share of the stock
- Per-trade loss threshold amount (from our investment profile)
- Peak drop threshold percent (from our investment profile)
Example
The following example illustrates this. Let's assume that we decided to invest in AAAA (which is now trading at $41.50 per share).
   Stock price = $41.50
   Per-trade loss threshold = $500
   Peak drop threshold = 8%

   Potential 8% loss per share
   *if* the stock price drops:
      = $41.50 x 8%
      = $41.50 x (8/100)
      = $3.32

   Thus, the maximum number of shares
   we can buy to ensure that the total
   loss in this trade does not exceed $500:
      = $500 / $3.32
      = 150
Buying more than 150 shares *in this trade* may cause
any potential loss to exceed our 'per-trade loss threshold' of $500, if the price
drops by our 'peak drop threshold' of 8%.
Now that we've computed the number of shares to buy, let's verify that a potential loss of 'peak drop threshold' percent on this position stays less than the per-trade loss amount.
Cost of shares
     = 150 x $41.50
     = $6225.0

Loss = Cost x (Peak drop threshold percent / 100)
     = $6225.0 x (8/100)
     = $498
$498 is just less than our 'per-trade loss threshold' of $500. If we buy more than 150 shares, we could potentially lose more than $500 if the stock price drops by 8%.
Suppose, instead of using position sizing, we buy as many shares as we could afford:
Allocated limit per stock = $10,000
  (Total principal = $100,000;
  Maximum #stocks = 10;
  $100,000 / 10 = $10,000)

Number of shares we can buy = 240
  ($10,000 / $41.50 = 240)

Then, potential loss (if price drops by 8%) = $796.00
  (240 shares x $41.50 = $9,960;
  $9,960 x 8% = $796.80)
Thus, If we buy as many shares as we can in a single trade (240 shares, in this example) instead of just 150, as suggested by position sizing, we could potentially lose up to $796.80 if the share price drops by our 'peak drop threshold' value of 8%. Instead, gradually increasing our investment restricts our potential losses to a maximum of $500 per trade. By being even more conservative and selecting a much smaller 'per-trade loss threshold' value, we could limit our exposure even further.
When to Buy More?
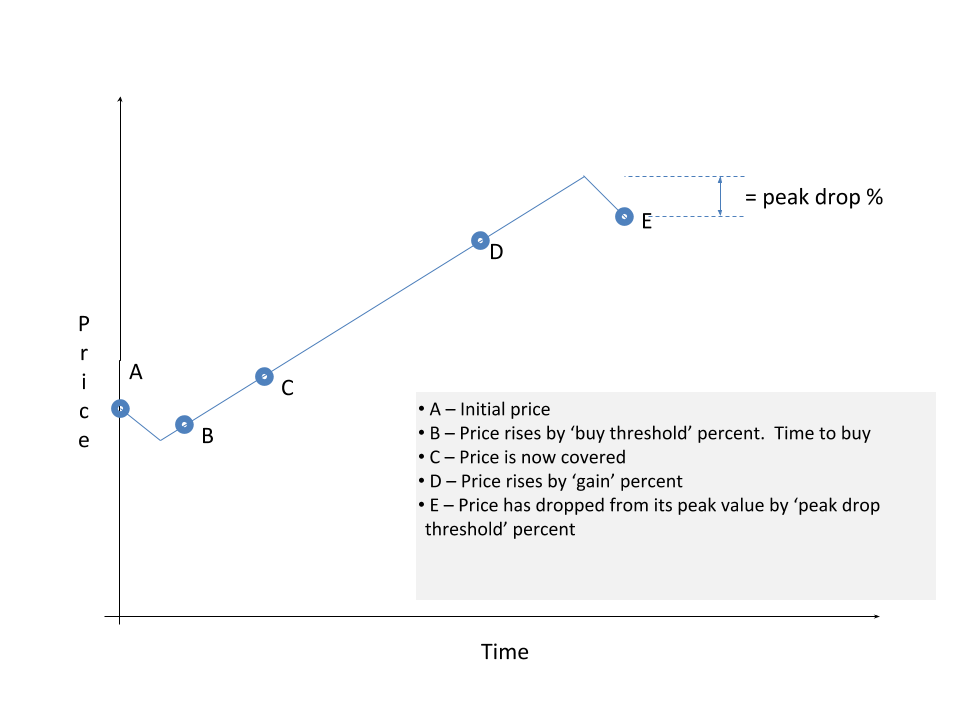
Now that we've used position sizing to buy just the right number of shares to minimize any potential loss, when do we buy more? The answer is simple: we wait for the stock price to rise until the increase is large enough to cover any potential loss. We're essentially asking the question: "what should the stock price rise to, such that, should the stock price subsequently drop by 'peak drop threshold' percent, the resulting stock price is still above our purchase price?"
The price at which our previous investment is 'covered' is called the covered price.
The figure below indicates the different points of interest during a stock price's life cycle.
Computing the Covered Price
We use the position sizing calculator to compute the covered price for us. For example, we bought shares of the stock AAAA at $41.50. Using the calculator, we feed in the following values:Share price = $41.50 Peak drop threshold = 8% Per-trade loss threshold = $500.00
The calculator tells us that the covered price is $45.11.
Let's verify that, when the stock price reaches $45.11, our investment is covered. Let's suppose that, having reached the covered price of $45.11, the stock price drops by 8%. It'll reach:
  Current price  = $45.11

  Potential price drop, if the price drops by 8%
                 = $45.11 x 8%
                 = $45.11 x (8/100)
                 = $3.61
In other words, once the share price reaches $45.11, even if it drops by 8% (by $3.61), it won't go below our purchase price of $41.50 ($45.11 - $3.61 = $41.50). Thus, once the stock price reaches $45.11, our original position is 'covered' and is thus safe, and we're ready to buy more shares of the stock. Of course, every time we buy shares of a stock we continue to use position sizing to determine the number of shares to buy to stay 'covered'.
Summary
We learnt how to determine the number of shares of a stock to buy, while keeping any potential losses to be lesser than our 'peak drop threshold' value. We also learnt how to determine when it's time to buy more shares of a stock.