Investing in Stocks - 4a: What to Buy - Simulating Stock Trading
Investing in Stocks - 4a: What to Buy - Simulating Stock Trading

In the previous article we looked at stock analysis, and using that, perhaps shortlisted some stocks as good candidates to invest in. In part 2 of the "what to buy" step, we'll look into a simulation technique to explore different investment strategies and their effect on stock performance historically.
Essentially, this is an exercise that answers the question "if we had invested in this stock N years ago using different strategies, how much would we have gained (or lost) today?" Doing such a 'what-if' simulation gives us some insight into which strategy worked best for a stock.
Note that, by its nature, the 'what-if' simulation uses historic stock performance data. As past performance does not guarantee future performance, the results of the simulation should not be used as a conclusive indicator. We do the simulation because recent performance of a company's stock price could tell us how the company is being run and how it and its products are perceived in the market.
Investment Profile Parameters − For Simulation
It is time to introduce a few more parameters to our investment profile. Since we're going to simulate buying and selling of stocks based on (simulated) price alerts, some of these parameters go into the 'Thresholds' section of our profile. (We'll explain thresholds in more detail later when discussing monitoring stock prices.) Here are the simulation-related parameters:
- Expected gain: This is the return (gain) percentage we're aiming to achieve in each stock. Simulation uses this value to simulate a 'sell'.
- Short term tax rate: This is our tax rate percentage for any gains made in the short term (≤ two years). Simulation will factor this in when simulating a 'sell' of the stock.
- Long term tax rate: This is our tax rate percentage for any gains made in the long term (> two years). Simulation will factor this in when simulating a 'sell' of the stock.
- Buy threshold: We all know that we should "buy low,"
but since no one can predict the lowest price of a stock, we do the next
best thing: we decide
that, if a stock's price drops and then rises by 'buy threshold' percent, it
will typically continue to rise further and is a candidate for buying. (If the stock price
continues to go down, we wait until it reaches a
'trough' value and then starts going up; in this case, the 'buy
threshold' is computed from the 'trough' value.)
Simulation will use this value to simulate a 'buy'.
The trick (or the difficult part) is to select the 'buy threshold' to be just big enough so that it indicates a genuine up-trend. Remember that the lower the 'buy threshold' value, the sooner we can buy the stock and be invested. However, the lower the value, the greater the possibility that the increase is just a blip and the stock price could drop again soon after.
- Peak drop threshold: This parameter decides the
percentage points by which a stock's price should drop from its peak
price for us to sell the stock.
Simulation will use this value to simulate a 'sell'.
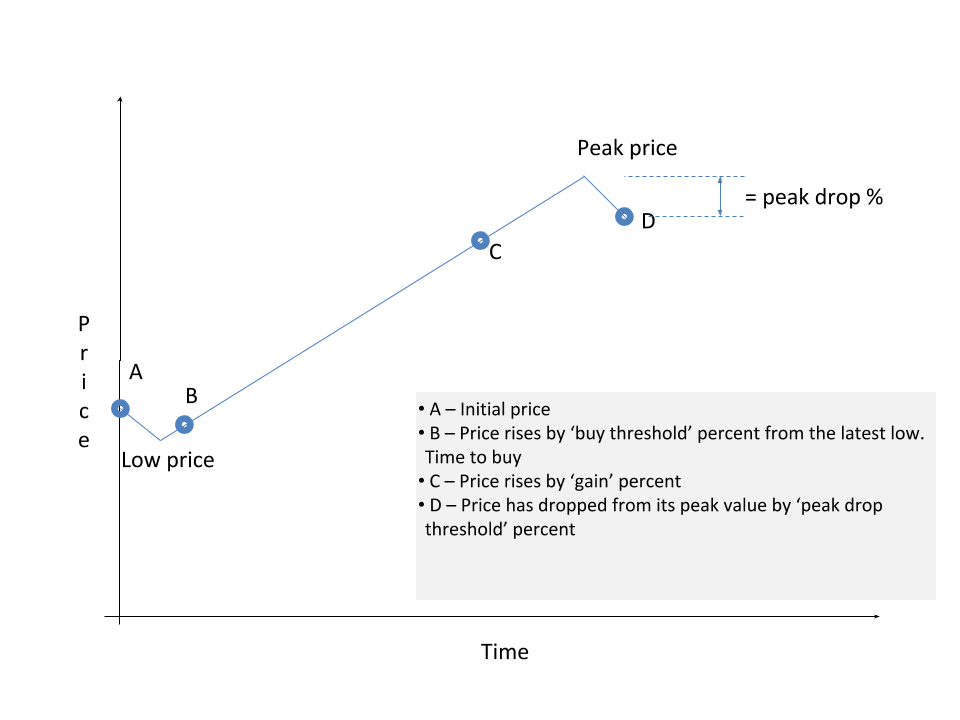
Note that this drop is calculated from the stock's 'peak' price. For example, assume that our 'peak drop threshold' value is 8% and that we buy a stock at $50. If the stock price rises and reaches $75 and then starts dropping, the 'peak drop threshold' will kick in when the price drops to $69: (peak price is $75; 8% of $75 is $6; $75 - $6 = $69).
Similar to 'buy threshold', 'peak drop threshold' needs to be carefully selected; just big enough that it indicates a genuine downward trend of the stock price, but also such that we don't wait too long to sell. A smaller value means that we can sell sooner and lose less, but it also means that, should the drop turn out to be just a blip and the stock price rises soon after we sell, we won't be able to benefit from any subsequent gain (remember that the moment we sell, we're no longer invested). Conversely, a bigger threshold value means we can stay invested longer, but also means that, should the stock price drop further, we might lose more money.
The figure below illustrates the threshold points:
Updated Sample Investment Profile
Let's take a look at our sample invest profile, now updated with these new values (the new parameters introduced above are shown in green).| General Parameters | ||
| Parameter | Value | Notes |
|---|---|---|
| Principal | $100,000.00 | Total money available to invest, across all stocks. |
| #Stocks | 10 | Maximum number of stocks we'll invest in. |
| Short term tax rate | 33% | Our short term income tax rate. |
| Long term tax rate | 20% | Our long term income tax rate. |
| Analysis Parameters | ||
| Parameter | Value | Notes |
| Health score threshold - performance | 6 | The stock should score at least 6 on the performance scale of 0 to 10. |
| Health score threshold - stability | 6 | The stock should score at least 6 on the stability scale of 0 to 10. |
| Health score threshold - fair price | 4 | The stock should score at least 4 on the fair price scale of 0 to 10. |
| Health score threshold - overall | 5.5 | The overall stock health score (average of the above three scores) should be at least 5.5. |
| Thresholds | ||
| Parameter | Value | Notes |
| Expected gain | 30% | The gain that we're expecting from our stock investment. This could be a conservative value (<10%) or an ambitious value. |
| Buy threshold | 4% | Percentage points by which a stock's price needs to rise (from its latest lowest ('trough') value) for us to invest in it. |
| Peak drop threshold | 8% | Percentage points by which a stock's price needs to drop (from its latest highest ('peak') value) for us to sell it. |
Performing Stock Trading Simulation
Investment Strategies
There are different stock investment strategies that can guide us as to when to buy, when to hold on to a stock, and when to sell. Each of these has its own pros and cons. A specific strategy may work better for one stock than for other.
Here are a few well-known strategies that we can use to simulate our investments:
- Passive — Buy and hold: "Buy good stocks and hold on to them as
long as possible; sell only when we really need the money."
This strategy works well for stocks that steadily increase in value. When using this strategy, we would buy a stock when the health analysis indicates that this is a good stock and that it's price is just rising above its latest 'trough' value. Then, we typically hold on to it.
- Peak — Buy lowest, sell highest: This one says "buy low (when
the price has risen enough to meet the 'buy threshold'), and
hang on to the stock until its price drops from its peak by
the 'peak drop threshold' percent."
This strategy has the potential to provide the maximum gain, but the difficult part here is to decide what the 'buy threshold' and 'peak drop threshold' values should be. When simulating this, we use a range of values for 'buy threshold' and 'peak drop threshold' to tell us what gain each of these combinations provided, and also which one provided us the best gain.
- Gain — Sell upon a fixed gain: this strategy is the non-greedy
version of the 'peak' strategy. It says "buy low (as soon as the price
has risen enough to meet its 'buy threshold'), but sell the
stock as soon as the 'expected gain' is reached (or when the price
drops from its peak by the 'peak drop threshold' percent, if it happens sooner)."
The good thing about this strategy is that the gain, once achieved, is locked in (by selling right away), and any subsequent drop in the stock price won't affect us. The downside is that if the stock price continues to rise after we sell, we'll be missing out on any subsequent gain.
The 'gain' strategy is very appropriate in the context of targeted savings. Having a specific purpose waiting for the investment gains to become available discourages us from staying invested even after we've achieved our targeted gains.
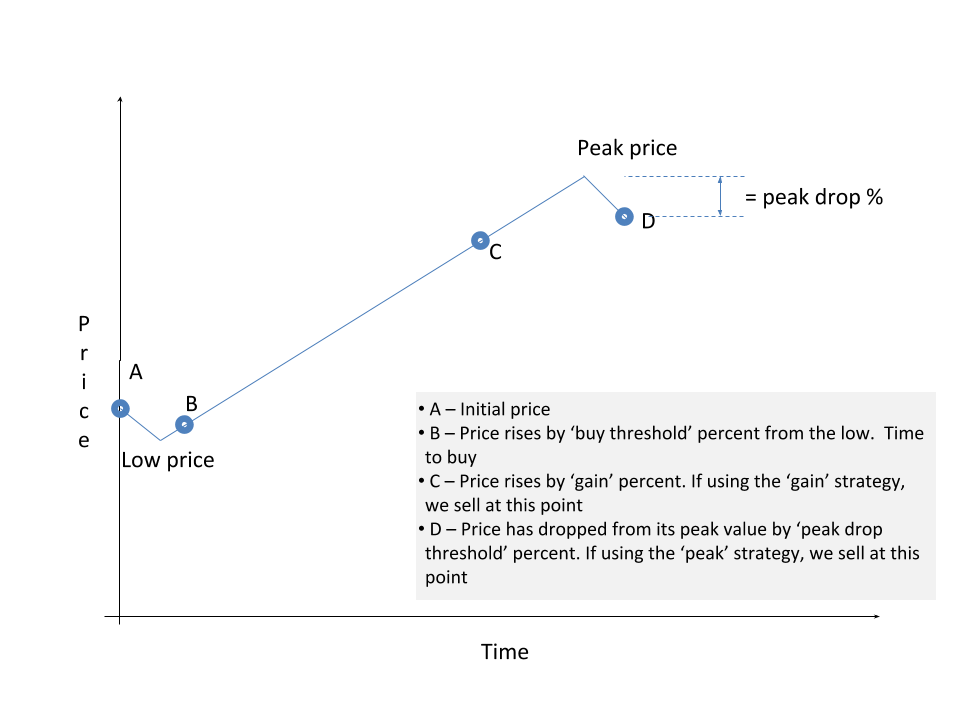
The figure below shows how the strategies affect when we sell a stock:
Summary
We got introduced to stock trading simulation — a technique that helps us understand a) how specific stocks behaved historically, b) how different investment strategies would have worked for different stocks, and c) how different buy/gain/sell thresholds would have affected our gains and losses.
The next article takes us through a sample simulation and helps us understand and interpret the results.