Investing in Stocks - 7: Position Monitoring
Investing in Stocks - 7: Position Monitoring
In the previous article we discussed buying stocks. Now it is time to start monitoring the stock price for the stocks we just invested in. This is known as position-watching or monitoring the position.
The purpose of position-watching is to be aware of any actionable events: our stock price has reached its 'gain' percent; price has peaked and then dropped by 'peak threshold' percent; and so on. In this article, we'll learn about the important events in the stock price life cycle and how to monitor them.
The figure below shows the significant milestones that occur as the stock price moves up or down. An explanation follows the figure.
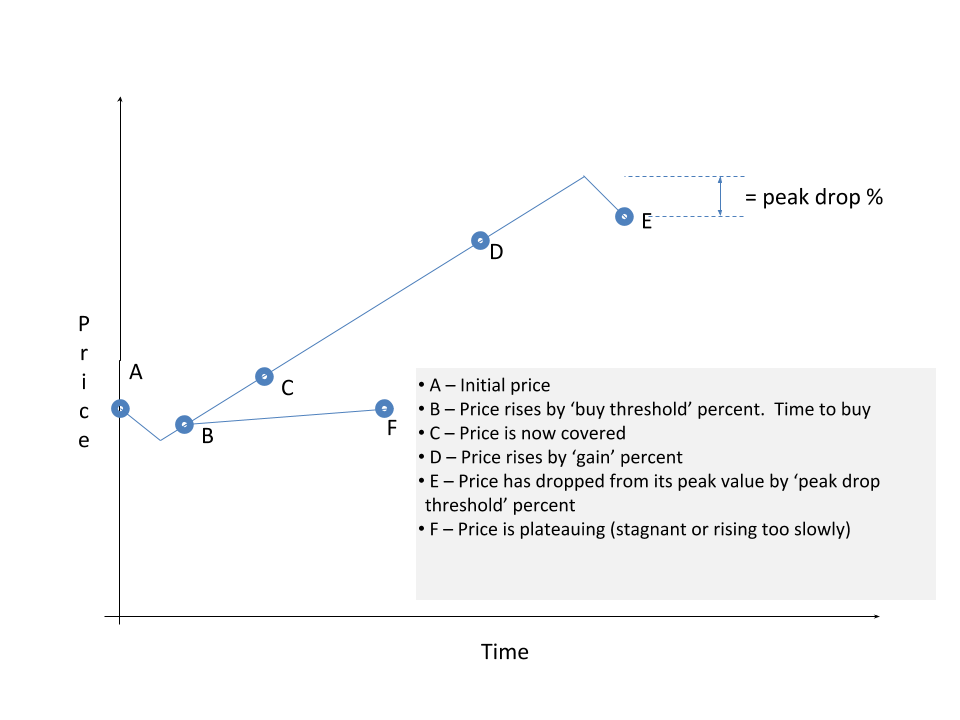
- A: This is when we started tracking the price in order to buy.
- B: The price went up indicating that it is rising. Action: good time to buy.
- (Not shown): Stock price dropped below our purchase price. We lost some of our principal. (Some reasons this could happen are that the underlying company performed badly, or the entire stock market suffered due to a world event, etc.) Action: Our actions could be sell, 'sit tight and do nothing' (if we feel that the price will recover), etc.
- C: Stock price increased to cover our purchase price. Action: we could decide to buy more shares.
- D: Stock price increased by 'gain' percent. Action: if we're using the 'gain' strategy, we could decide to sell at this point and lock in our gains.
- E: Stock price dropped by 'peak drop threshold' percent from its most recent peak price. Action: if we are using the 'peak' strategy, we could decide to sell.
- F: Stock price is growing too slowly or is almost sitting still. Actions: sit tight, sell and invest in another (more promising) stock, etc.
Investment Profile Parameters
To track these events, let's augment our investment profile with relevant parameters. Most of the parameters required by position-watching are already there ('buy threshold', 'expected gain', 'peak drop threshold', etc.) We add just one more parameter:
- Plateau threshold: This is a pair of values (percentage, days)
to see if a stock's price isn't rising or is rising too
slowly. It is very rare that a stock price stays
dormant for 10 months and then goes up hugely in the last two months
to yield an annual gain of, say 30%. Stock prices need to rise
several times (though not necessarily at a constant rate) throughout the year
in order to produce any decent gains.
'Plateau threshold' is used to track stocks whose prices are not
rising.
For example, we could decide that a stock whose price hasn't risen by at least 7% in the last 90 days is not going to match our expected gain percent of 30% this year, and thus needs a second look.
Sample Investment Profile
Here's what the updated profile looks like:
| General Parameters | ||
| Parameter | Value | Notes |
|---|---|---|
| Principal | $100,000.00 | Total money available to invest, across all stocks. |
| #Stocks | 10 | Maximum number of shares we'll invest in. |
| Short term tax rate | 33% | Our short term income tax rate. |
| Long term tax rate | 20% | Our long term income tax rate. |
| Analysis Parameters | ||
| Parameter | Value | Notes |
| Health score threshold - performance | 6 | The stock should score at least 6 on the performance scale of 0 to 10. |
| Health score threshold - stability | 6 | The stock should score at least 6 on the stability scale of 0 to 10. |
| Health score threshold - fair price | 4 | The stock should score at least 4 on the fair price scale of 0 to 10. |
| Health score threshold - overall | 5.5 | The overall stock health score (average of the above three scores) should be at least 5.5. |
| Thresholds | ||
| Parameter | Value | Notes |
| Expected gain | 30% | The gain that we're expecting from our stock investment. This could be a conservative value (<10%) or an ambitious value (>25%). |
| Buy threshold | 4% | Percentage points by which a stock's price needs to rise (from its latest lowest value) for us to invest in it. |
| Peak drop threshold | 8% | Percentage points by which a stock's price needs to drop (from its latest highest value) for us to sell it. |
| Per-trade loss threshold amount | $500 | Maximum amount we're willing to risk losing in a single trade. |
| Plateau threshold | 7% in 90 days | If a stock hasn't risen by 7% in the last 90 days, take a second look at it. |
Event Alerts
Now that position-watching has all the parameters it needs to do its job, we want to be alerted when any event of interest occurs. We can group these alerts into: a) price increase-related alerts, b) price decrease-related alerts, and c) plateau-related alerts.
Price Increase Alerts
This can be one of:
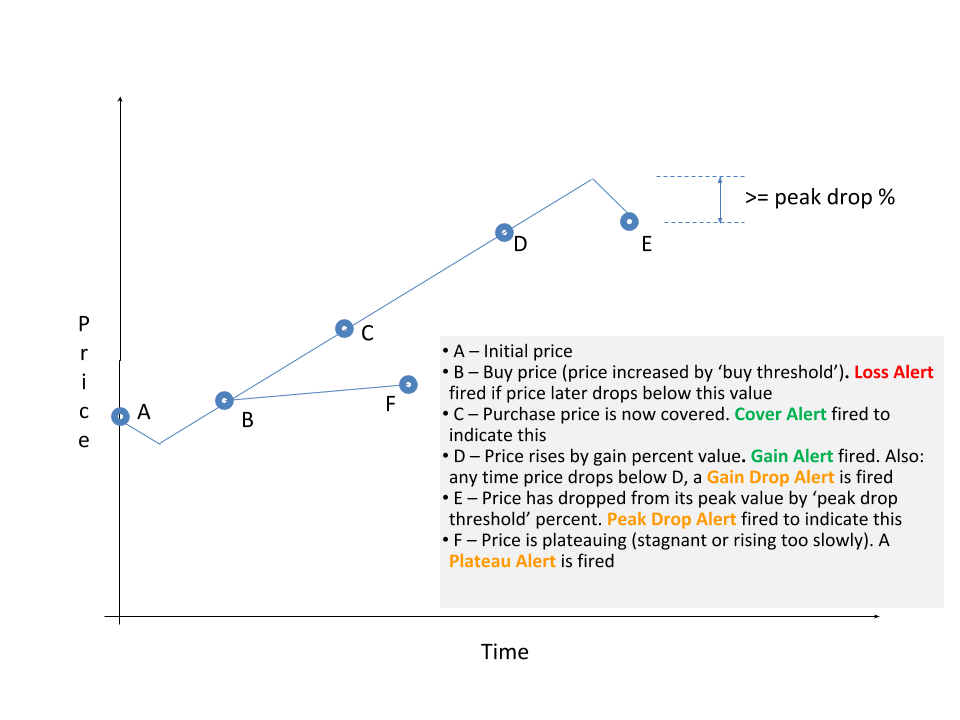
- Trough alert: a trough alert is the reverse of a 'peak' alert — it notifies us when the stock price has risen up by 'buy threshold' percent after reaching its lowest ('trough') point. We typically use trough alerts to track the up-trend of stocks that we want to buy.
- Cover alert: tells us when the stock price has risen enough such that our purchase price is now safe and we can decide to buy more. (We discussed 'covered price' in the article Investing in Stocks - 6: Buying Stocks.)
- Gain alert: indicates that the stock price has risen enough to meet our expected gain. Upon receiving this alert, we could decide to play safe and sell the stock and take the gain, or be greedy (er, optimistic) and continue to be invested in the stock!
Price Decrease Alerts
- Loss alert: the stock price has dropped below our purchase price. This indicates certain loss. Typically we would decide to sell and stop our losses at this point. However, in certain cases, we could decide to stay invested (e.g., if we believe the loss is due to a market correction and not because of the underlying company's weakness, and thus the stock will bounce back quickly; or if we're using the passive 'buy and hold' strategy for this stock and have decided to ride out any downs, up to a point).
- Gain drop alert: this tells us that the stock price that had earlier reached or exceeded our 'gain' percent has now dropped below the 'gain' percent. This is more of an informational alert; there may not be anything for us to do.
- Peak drop alert: the stock price had reached a peak earlier and has now dropped from its peak by 'peak drop threshold' percent. If we're using the 'peak' strategy, we will typically decide to sell the stock, unless we believe that the drop is a temporary blip and the stock price could rise further.
Price Plateau Alerts
- Plateau alert: a plateau alert informs us that the stock price hasn't moved up by at least our 'plateau threshold' percent in the last so many days. Upon receiving a plateau alert, if we find a better performing stock (as indicated by our "what to buy" criteria), we could decide to sell the non-performing stock and invest in the better one. We could also decide to hang on to the stock if market vagaries tell us so (for instance, if all stocks took a beating in a certain quarter).
The figure below illustrates the possible events in a stock price's life cycle and shows which event causes which alert to fire. This is a simplistic illustration of the stock price's life cycle. In reality, there will be many ups and downs.
Example Stock Price Life Cycle Events
Let's say we took a position in stock AAAA at $41.50. The alert-related parameters in our sample investment profile are:
Buy threshold:          4%
Expected gain percent: 30%
Peak drop threshold:    8%
Plateau threshold:      7% in 90 days
Let us watch the hypothetical progress of the stock price of AAAA to learn which events in the stock price's rise/fall cause which alerts. The purpose of the table below is only to illustrate the alerts fired. We've already discussed above some possible actions upon receiving an alert.
| Stock price | Event/Condition | Alert triggered |
|---|---|---|
| $39.90 | We just started tracking AAAA stock. | |
| $41.50 | The stock price rises by 4% ('buy threshold' percent). | We get a 'trough' alert. |
| $41.50 | We purchase AAAA at this price. | |
| Possibility 1: price drops to below $41.50 | The price drops to below the purchase price. | 'Loss' alert. |
| Possibility 2: price stays at $42.00 for 90 days. | The price doesn't drop, but is stagnating. It doesn't rise either by at least 7% in the last 90 days (our 'plateau threshold' value). | 'Plateau' alert |
| Possibility 3: price rises to $45.11 | The price rises enough so that a 8% drop ('peak drop threshold') will not cause the stock price to go below our purchase price. Our position is now 'covered'. | We get a 'cover' alert to tell us that our position is now safe. |
| $54.00 | The price continues to increase by 30% (our 'expected gain percent'). $41.50 + ($41.50 x 30%) = $53.95 | 'Gain' alert. If we sell the stock now, we'll make a gain of 30%. |
| Anything below $54.00 | After reaching $54.00 earlier, the price now drops to below $54.00. | 'Gain drop' alert. (This will occur if we don't sell the stock when it rose by 30% earlier.) |
| $70.00 | Alternatively, upon reaching $54.00, the stock price continues to rise and reaches $70. | |
| $66.50 | After reaching a price of $70, the stock price drops to $66.5. | No alert is fired, since the drop is only 5%,
less than our 'peak drop threshold'. ($70.00 − $66.50) / $70.0 = 5%. |
| $64.40 | The price drops from the peak price of $70 by 8% (the 'peak drop threshold' value). | 'Peak drop' alert. ($70.0 − $64.40) / $70.0 = 8%. |
Setting Up Alerts
There are a few approaches to implementing position-watching and alerting:
- Use a commercial service. Several such services are available on
the Internet. Your stock broker or financial advisor may also
offer such services. Note that a single service may not offer all
the alerts we're interested in, so we could need more than one
such service. Also, each service may use a different terminology
(e.g., 'peak' alert may be called by a different name), so we
might have to 'translate' our event and alert names into the names
understood by the service.
When selecting an online service, we may want to check for additional features to make life easy for us:- Does the service provide a choice of alert notification channels (email, texting, a visual 'dashboard', etc.)?
- Does the service provide us the ability to turn automatic trading on/off? We'd prefer the service to only notify us and not automatically perform any 'buy' or 'sell' actions, for a few reasons: If prices are changing rapidly, automated buying/selling could result in corresponding rapid and cascading transactions such that one can easily lose track of what exactly happened. And, as we saw earlier, before we decide to act on an alert we would like to ensure that any price drop is a real drop and not a temporary blip (due to market conditions, etc.). An automated computer application/service may not be able to make this distinction.
- We could implement position-watching ourselves "by hand": simply use a spreadsheet (either on paper or on our computer) to get stock prices every day and compare them with previous values. (For medium- and long-range investments, checking the prices once a day might be sufficient.)
- If we're inclined to write computer programs ourselves, we could automate the "by hand" process using a computer program.
Summary
Understanding the stock price life cycle and its event milestones is a great way to ensure that we're on top of our investments and take timely actions to maximize our gain and minimize losses.